
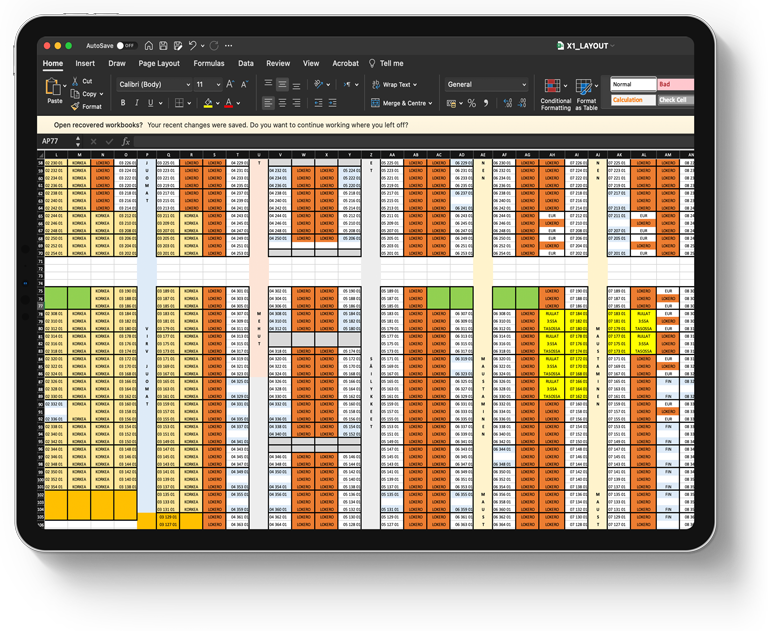
Warehouse Analysis
WareBee measures the KPIs that matter. Our analysis will help you to uncover issues and improve performance.
Analyse your warehouse using ABC analytics, KPIs, and detailed order routes analysis — all in one unified view.
Learn more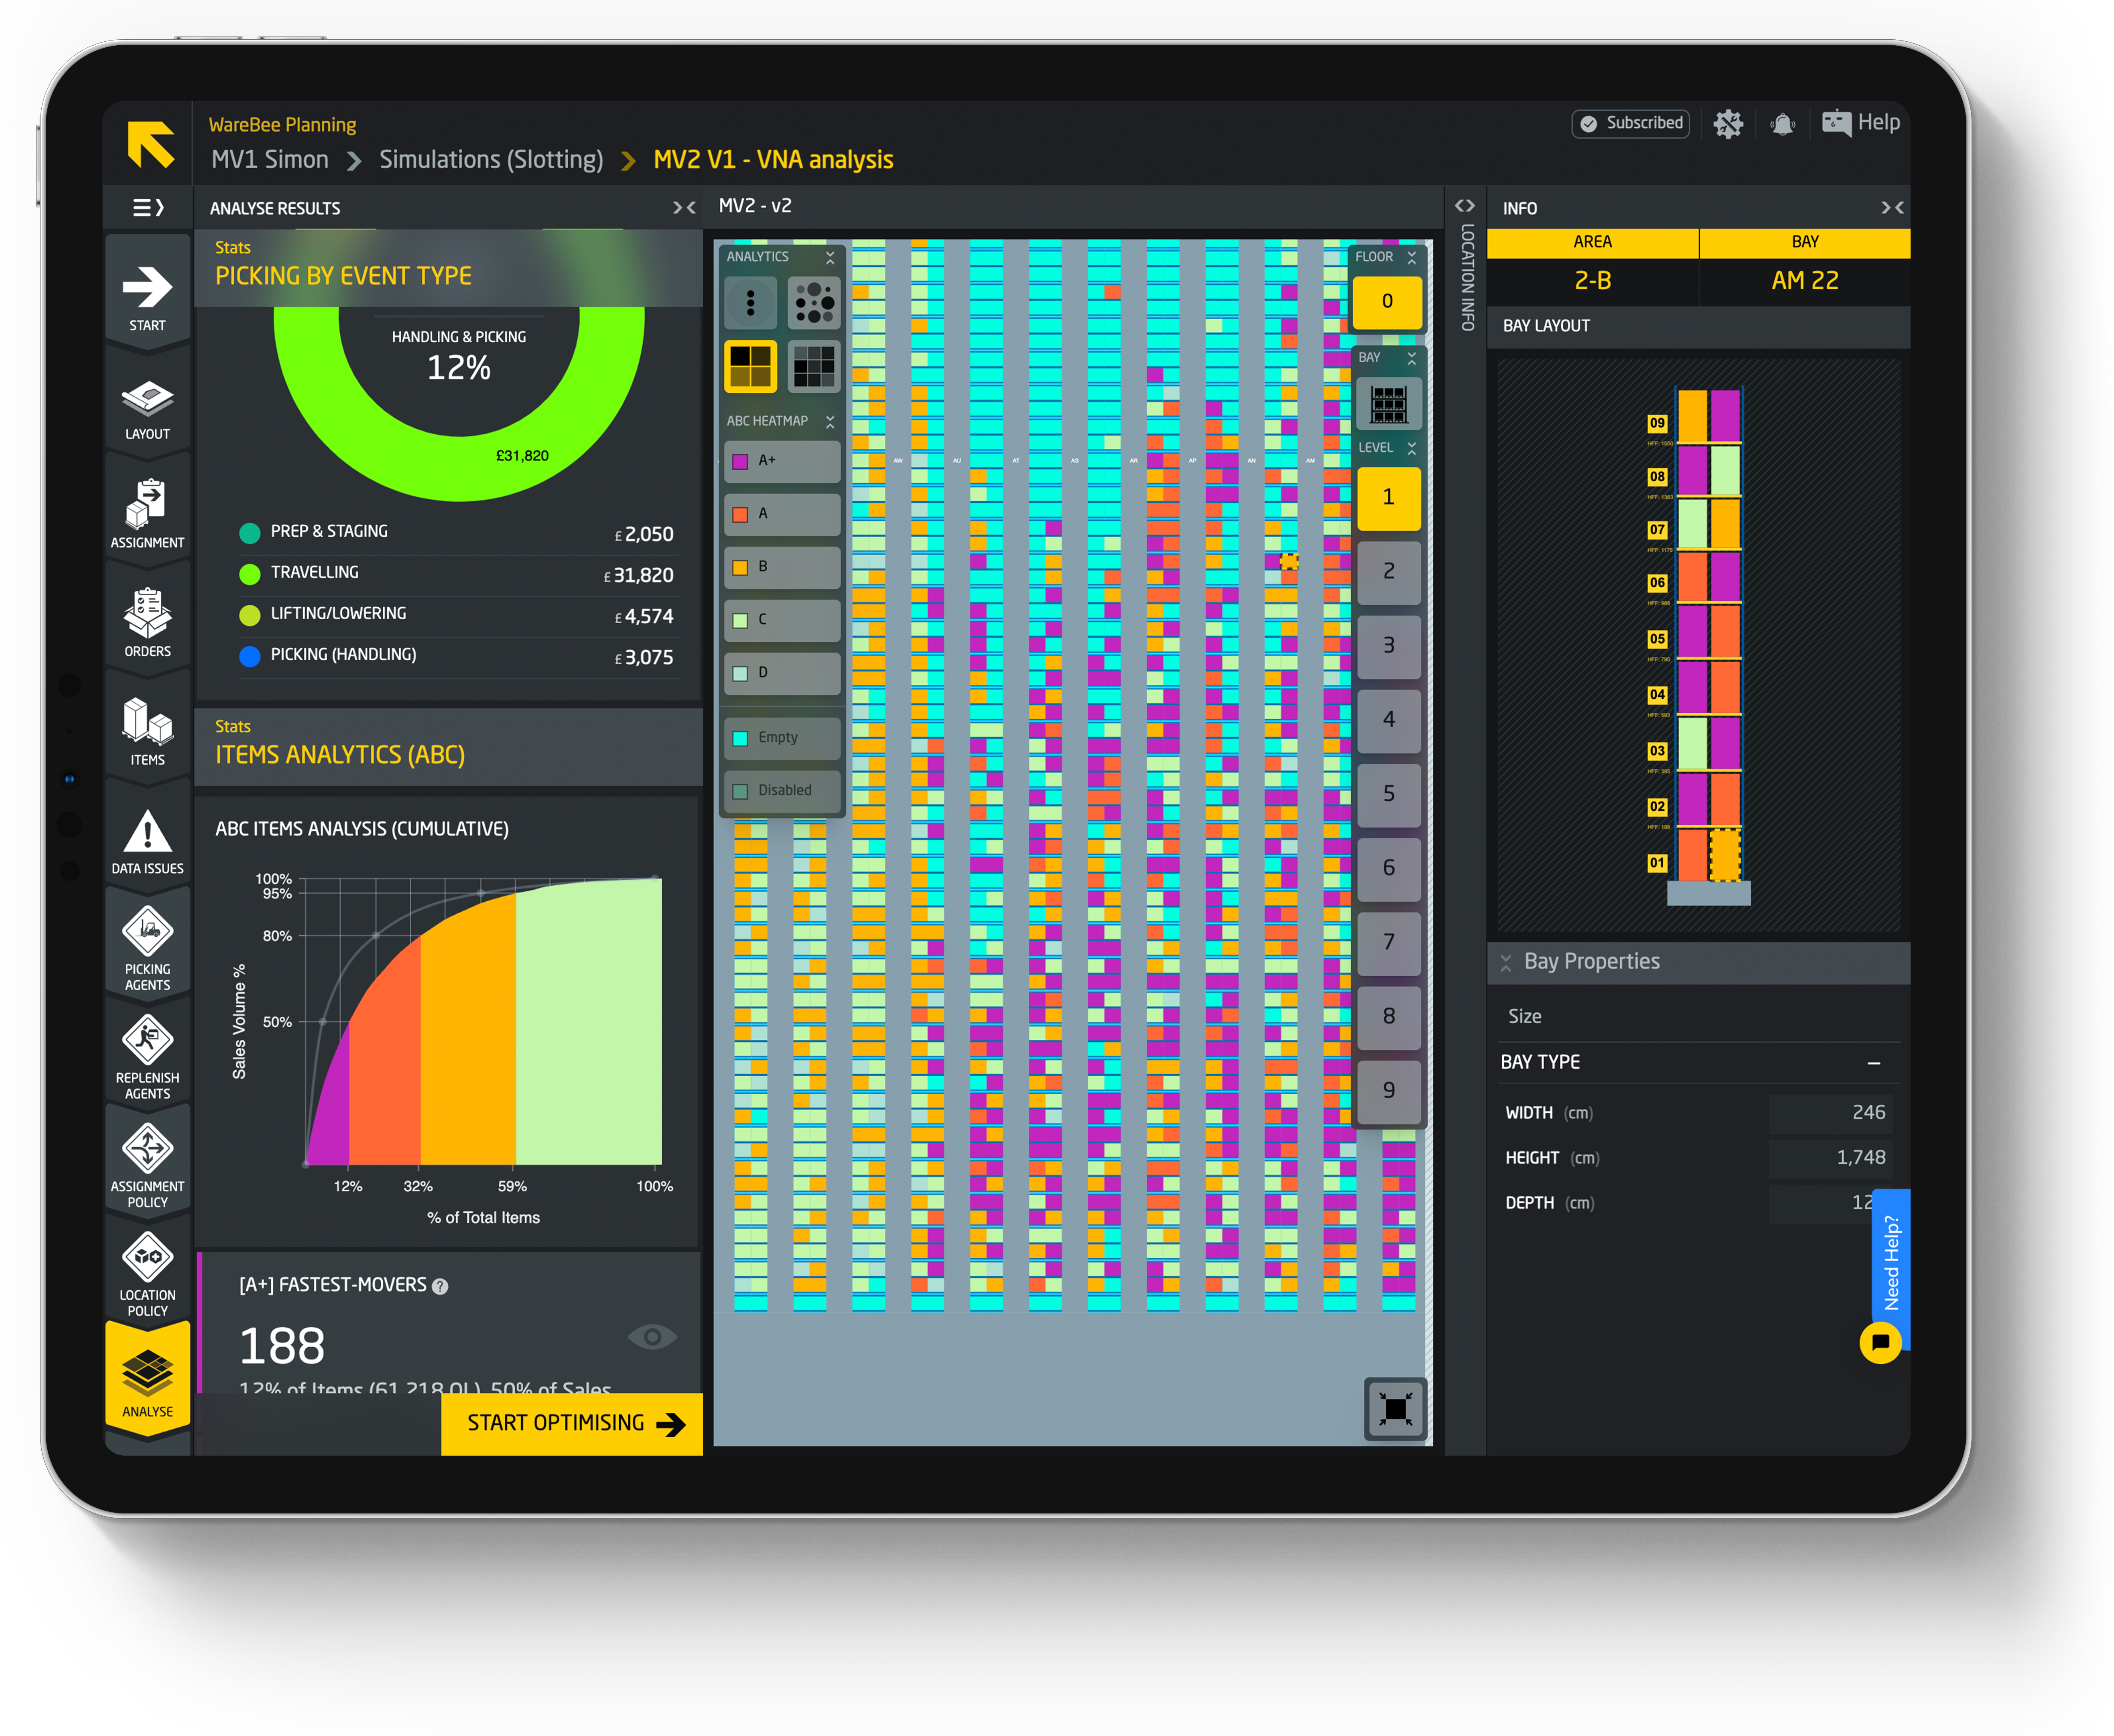
Order picking cost
Understand your "cost to serve" on the order level.
Drill into fulfilment cost of the individual order, working time distribution, travelling distance analysis and operational inefficiencies.
Learn more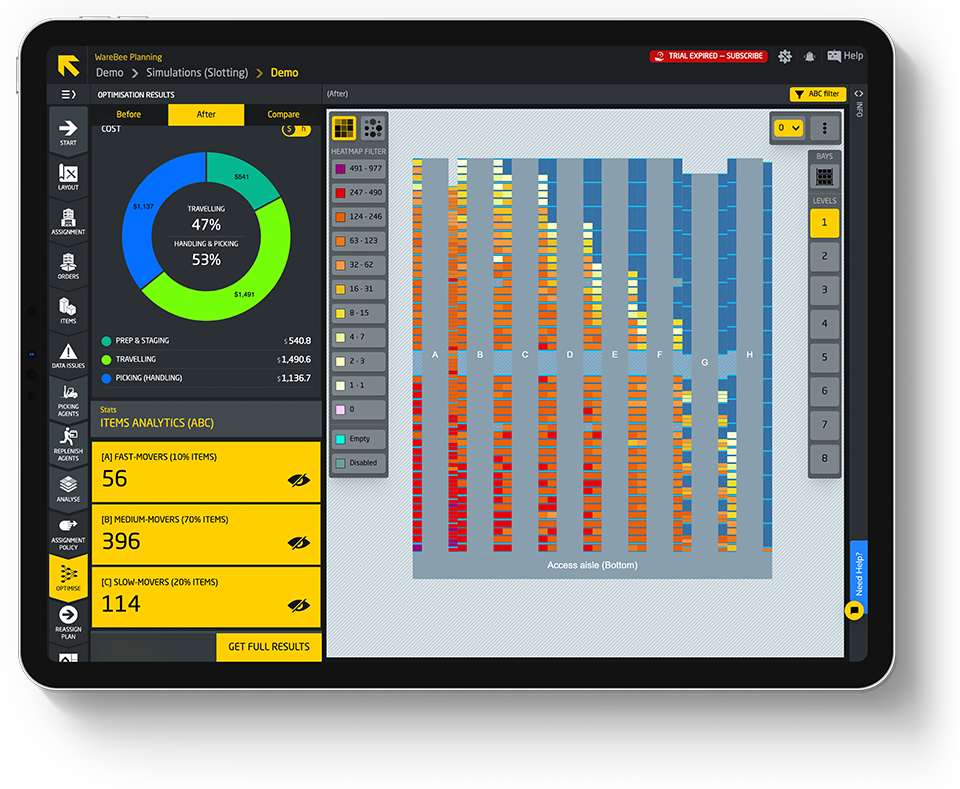
ABC Analysis
See where your fast movers are placed.
Compare heatmap view, bay and location view, and replenishment impact — all driven by your actual order data.
Learn more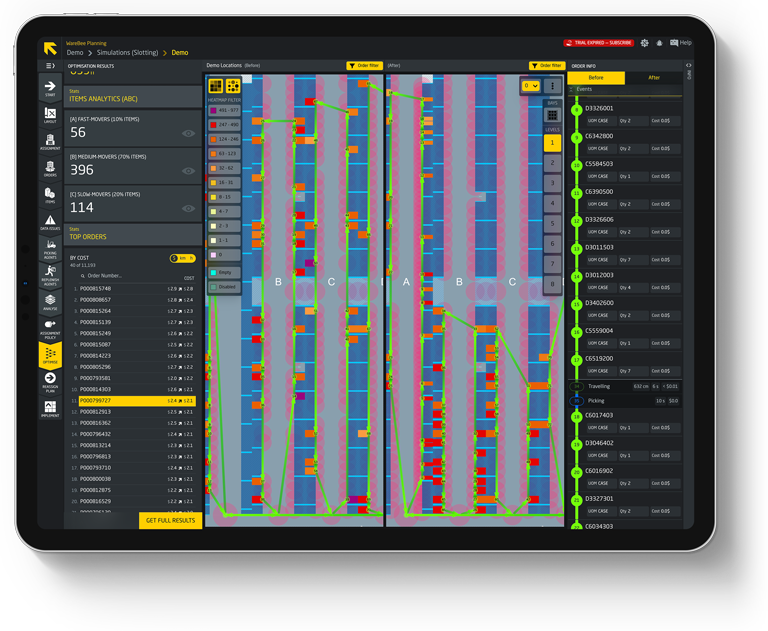
CO2 footprint
Report accurate CO2 footprint of every warehouse activity.
Calculated based on actual operations, country-specific CO2 rates, and MHE-specific emissions — for credible sustainability reporting.
Learn more
And more tools for warehouse analysis
Analyse your warehouse using ABC analytics, KPIs and detailed order routes analysis.
Congestion Analysis
Identify traffic bottlenecks on location and aisle levels.
Cross-traffic and queuing at pinch points surface on the layout itself, so you know which aisle to widen or which pick path to re-route before the next peak.
Workforce and equipment utilisation
Compare resource utilisation across your workforce and MHE fleet.
See which shifts run lean and which trucks sit parked, on the same scale — so headcount and fleet decisions rest on one comparable number instead of two separate guesses.
Stackability
Find where your heavy items are crushing the fragile ones.
Weight and fragility ratings run against slotting order across the pallet, layer by layer, before a claim shows up as damaged goods on the receiving dock.
Idle time breakdown
Count unproductive idle time per resource, so you can rebalance shifts and assets.
Gaps between tasks split out by cause — waiting on a dock, a blocked aisle, no work queued — turning a single idle-time number into a punch list of what to fix on the floor.
Replenishment analysis
Realise the replenishment overhead on your operations before it erodes throughput.
Every top-up trip is costed against the pick time it protects, so you see exactly which replenishment cycles are worth the trip and which are quietly eating capacity better spent on outbound.